Description
This book introduces children to bar graphs. Bar graphs require gathering, charting, and comparing data. Children will learn these key skills for assessing progress and making predictions.
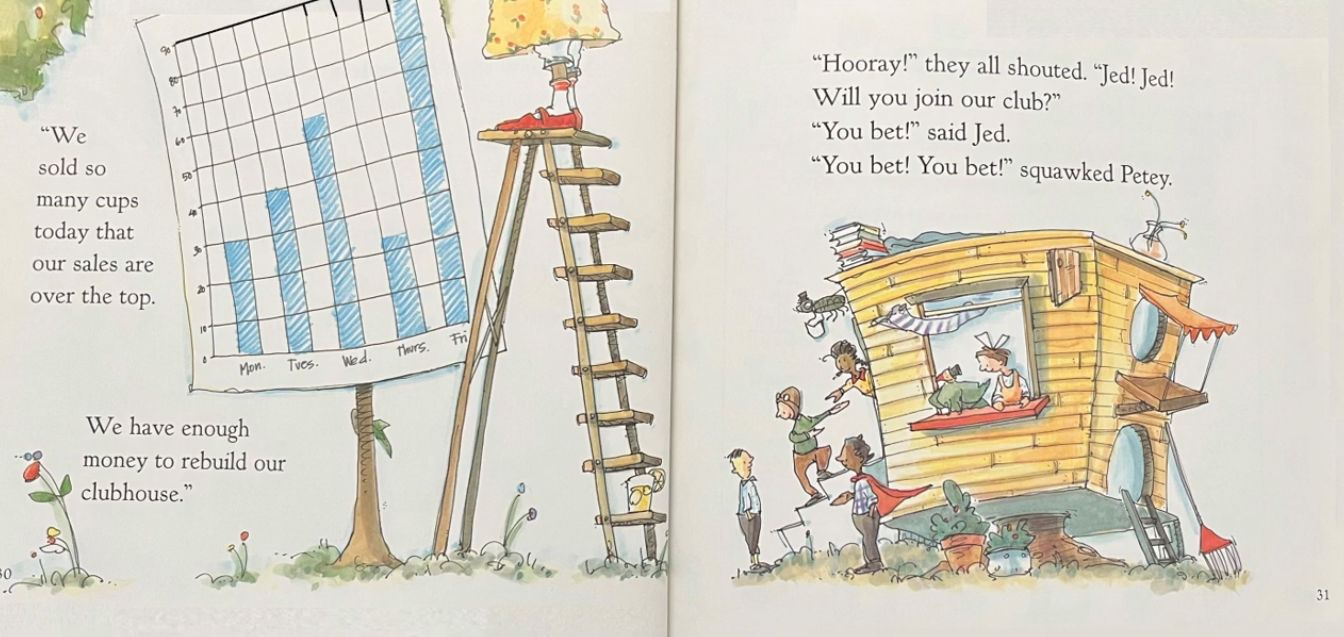
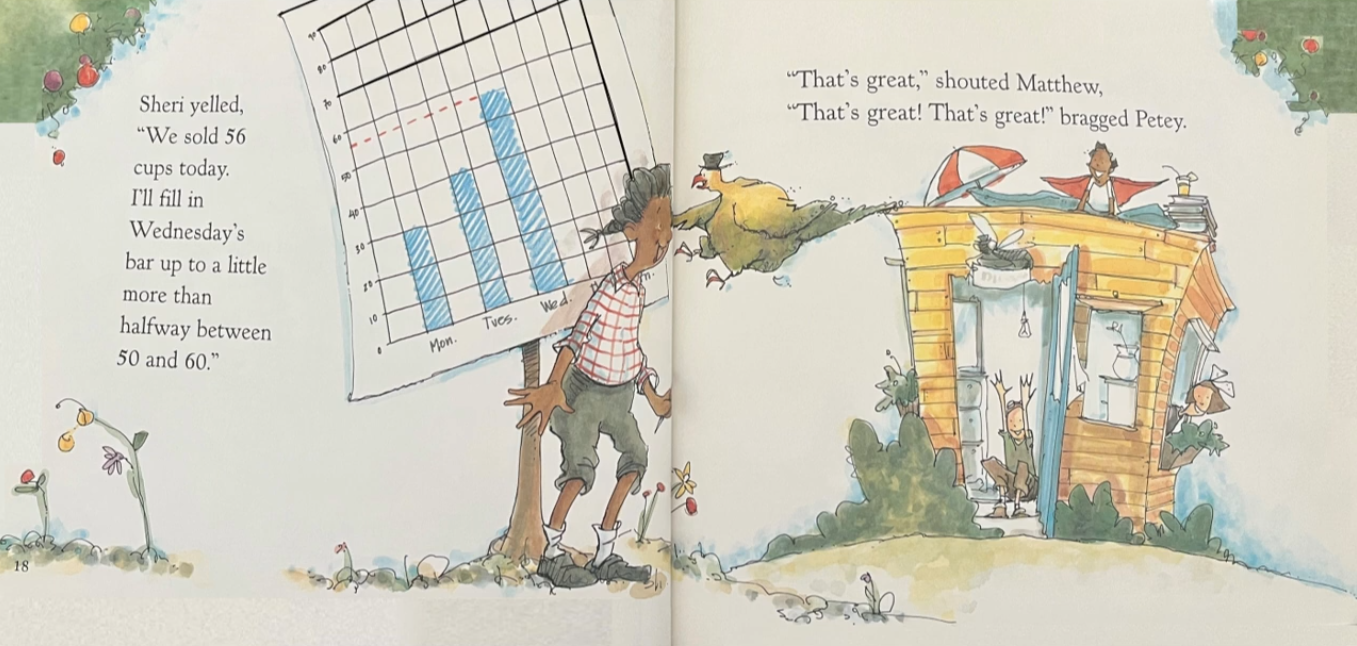
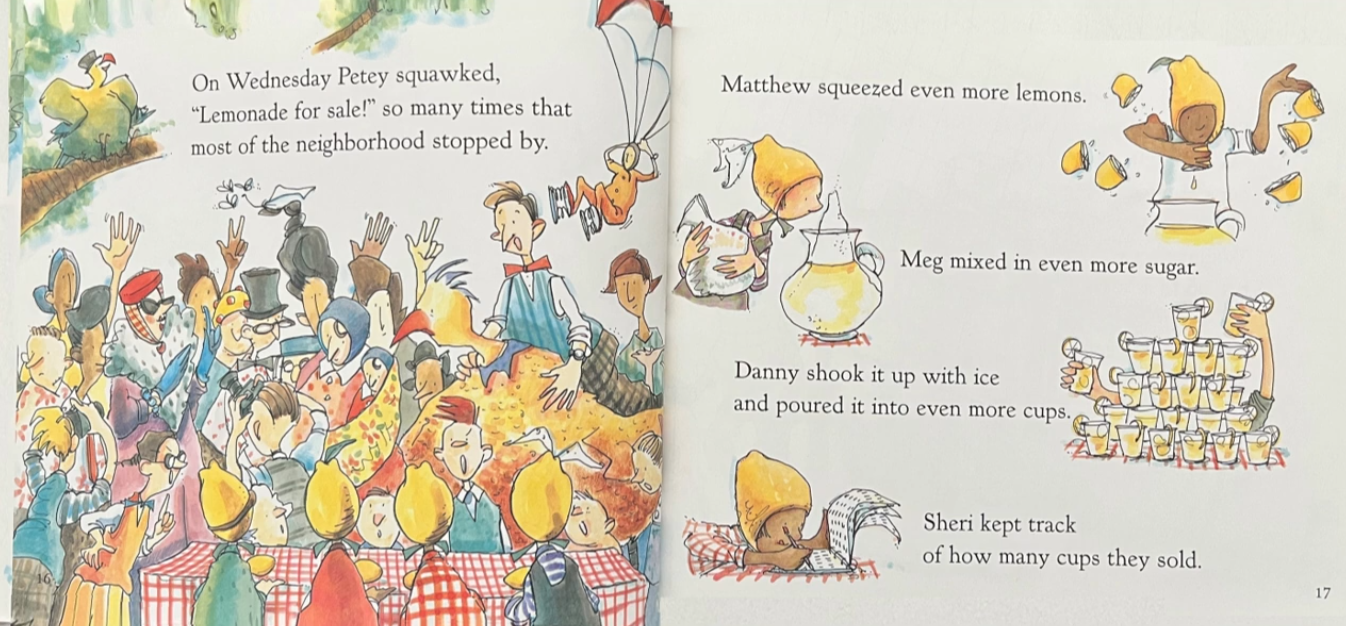
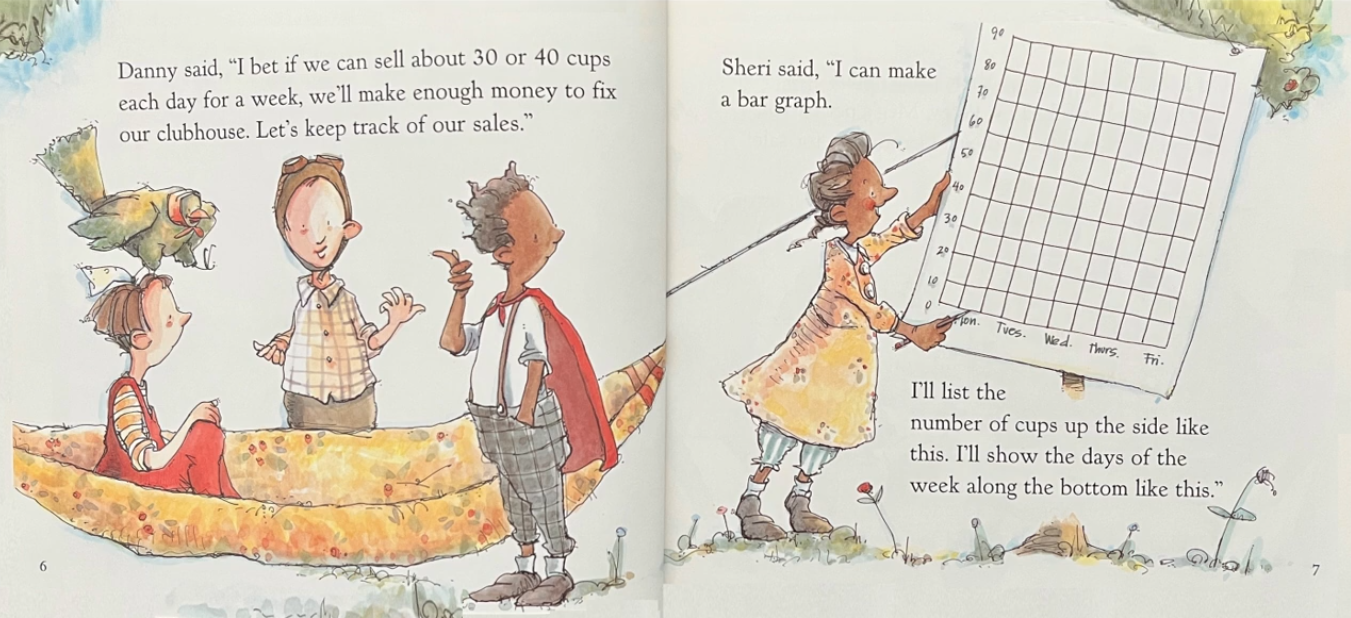
In this story, the Elm Street Kids decide to raise money by selling lemonade. At first, business booms, but then it drops off. The Elm Street Kids use a bar graph to plot the number of cups sold on each day of the week and figure out what to do. Young readers may be inspired to start their own lemonade stands—and use a bar graph to plot their progress.
From Amazon – CIS:
My 2nd grade students LOVED this book! We read it in the middle of our “graphing” unit, and it provided excellent support for bar graphing in terms and circumstances that they could relate to! They have been begging to have a Lemonade stand at a school event ever since we read it!
Highly recommended!


Leave a Reply